
See Clearly Below,
Read Growth Better.
Visible growth,
evidence-based decisions.
From underwater perception to actionable farming insight.
Starting from images, we link fish-body scale, school state, and operational value into a continuous information chain — from sensing to decisions.
Image Enhancement
Noise removal · detail recovery
Stereo Measurement
Individual metrics · school density
Density Quantification
Spatial distribution · school changes
Behavior Recognition
School state · anomaly detection
Economic Assessment
Cost accounting · ops guidance
Let the details hidden by water re-emerge.
Targeting light attenuation, water scattering, and colour shift, a five-stage preprocessing pipeline improves imaging, providing clearer input images for downstream fish recognition.

Five-stage preprocessing pipeline
- 01Bilateral Filter Denoising
- 02Gamma + Grayscale Stretching
- 03Dark-channel De-scattering / Dehazing
- 04CLAHE Local Contrast Boost
- 05USM Lightweight Detail Sharpening
Underwater vision input sample: processing effects need to be verified against water conditions.
Clear imaging is not the destination — it is the starting point that makes recognition and measurement more reliable.
From 2D images to real scale.
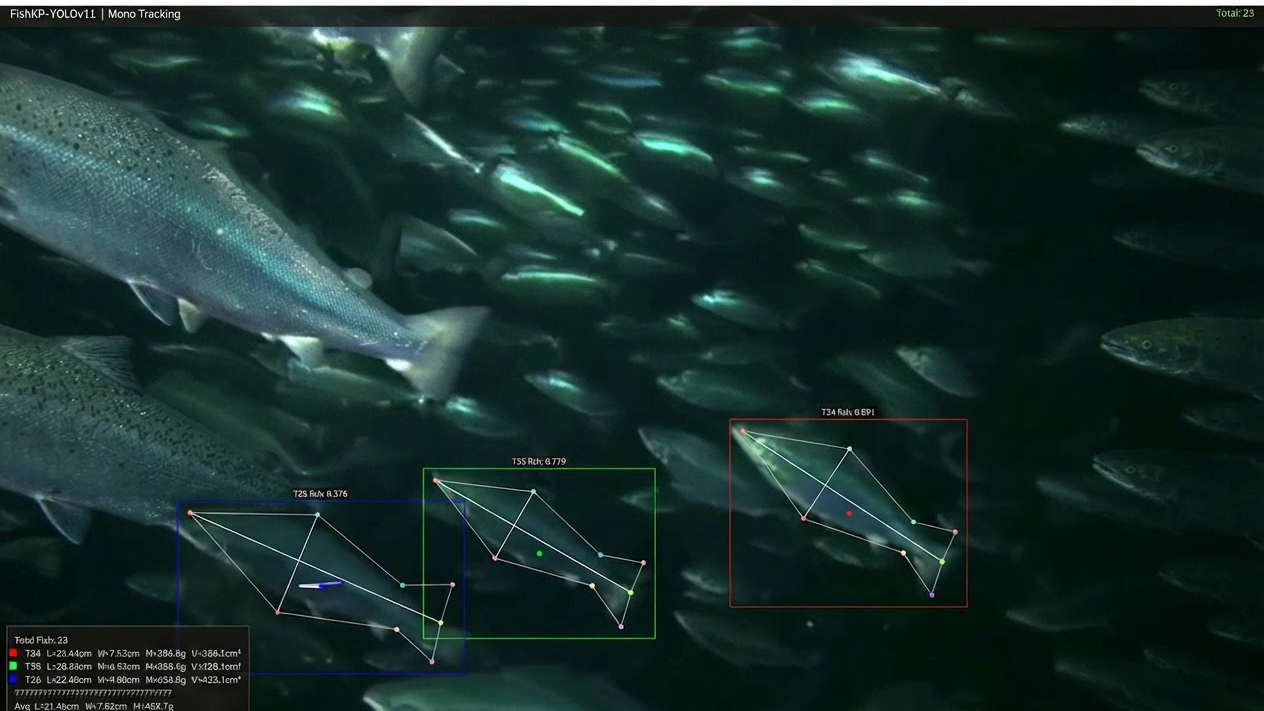
Solving 3D coordinates via stereo disparity and correcting perspective distortion, turning keypoints into body length and per-fish biomass data, providing a basis for growth tracking and sonar model calibration.
Underwater fish keypoint detection and length / mass estimation · technical material frame
- 01Keypoint DetectionIdentify fish keypoints, building target features needed for measurement.
- 02Stereo 3D ReconstructionRecover spatial scale via stereo camera disparity, estimating true fish body length.
- 03Per-fish Biomass EstimationCombined with a random forest regression model, calibrating the sonar prediction model.
Vision Measurement
Body length and per-fish biomass estimation provides ground truth reference for acoustic models.
Acoustic Supplement
When vision is limited by turbidity or low light, multi-beam sonar supplements dim scanning.
Not just seeing schools, but seeing how their state changes.
Visualizing spatial distribution, swimming speed and group characteristics, observing density changes over time and surfacing stress-escape, over-aggregation, and stagnation anomalies.
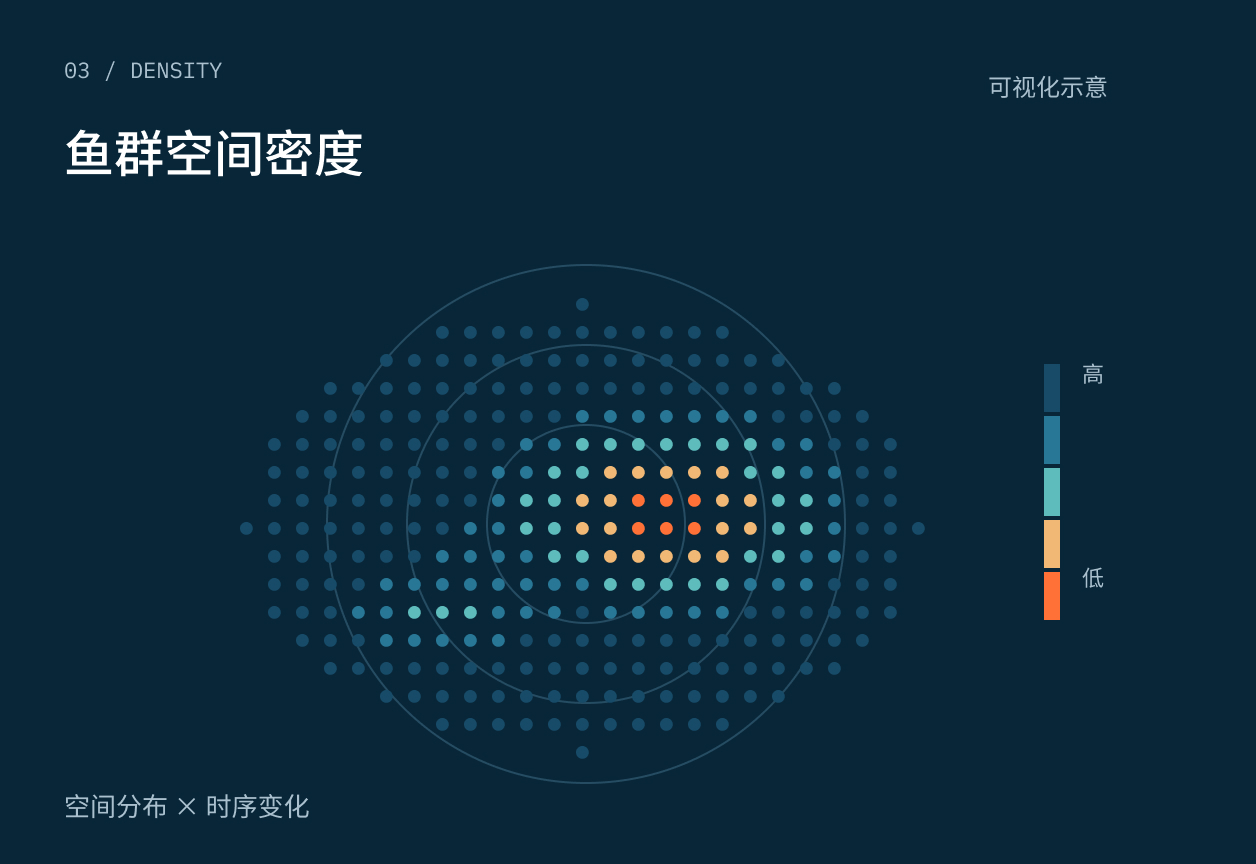
Density changes, trace by trace
Count fish projection ratio per unit water, presenting school distribution and changes via spatial density heatmap.
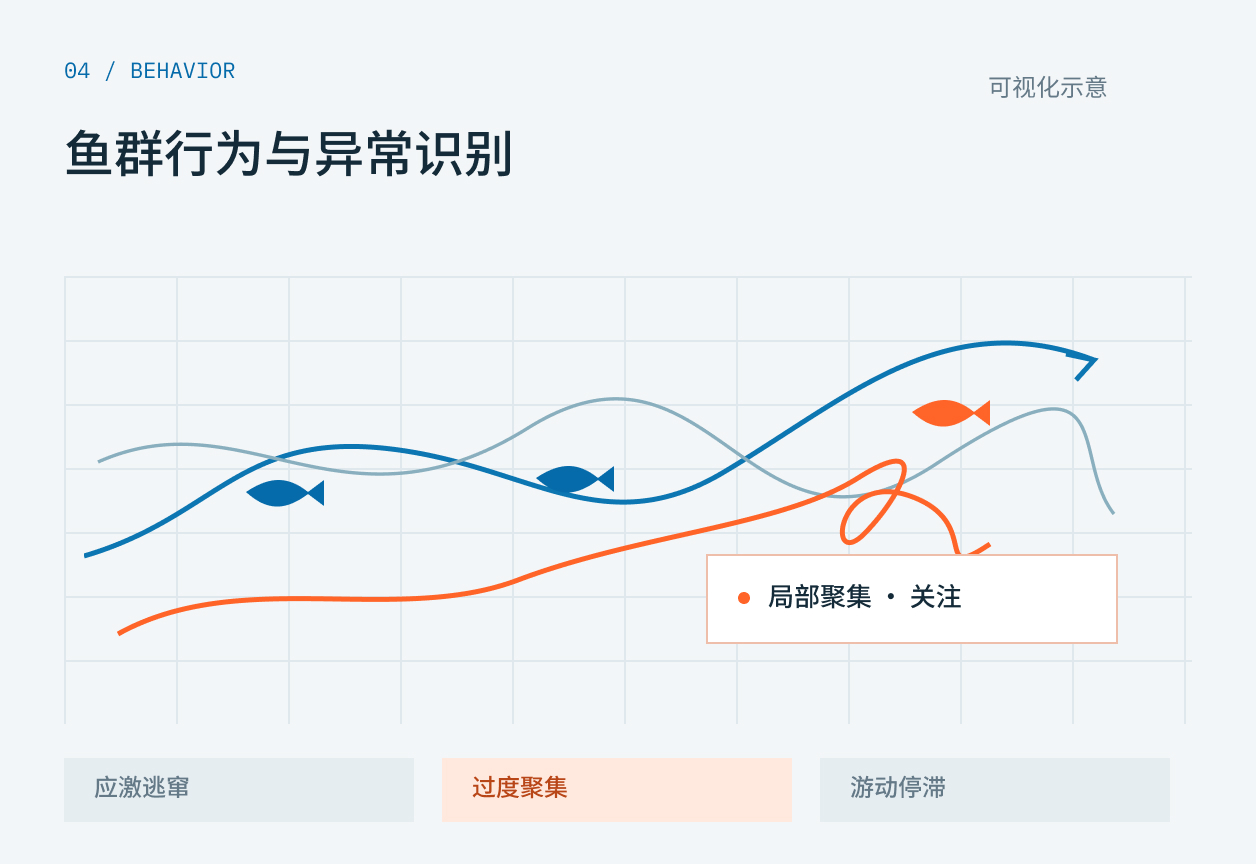
Turning anomalies into visible signals
Extract swimming speed, orientation, and group characteristics, turning abnormal behavior into actionable farming alerts.
Heatmaps and trajectories are interface illustrations — not on-site measurement results.
Connect every bit of growth to operational value.
Linking biomass, survival rate, body length and market price, placing batch cost, output and operational trends in one view, supporting feeding, harvesting, and sales planning.
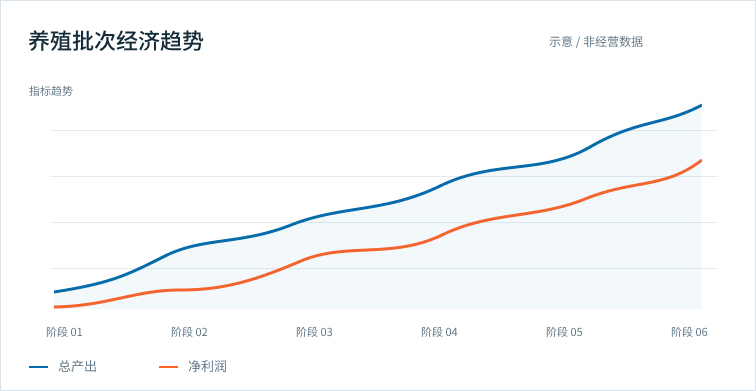
- 01Monitoring InputsBiomass · survival · body length
- 02Cost & PriceFarming cost · market price
- 03Operational OutputsTotal output · net profit · profit margin · ROI
- 04Operations AdviceFeeding · harvesting · sales
Engineering judgment with process and evidence.
From sample conditions to control measurements, jointly defining the scope of technical validation. Conversations can start with the materials below.
Record species and body specs
Document water, lighting, and imaging conditions
Define sample labeling rules
Prepare manual measurement and control data
Cross-check model output vs. measurement
Record error, conditions, and applicable scope
Validation scope and effects should be confirmed against sample and on-site conditions. The tech team is available to discuss required materials.
Let underwater change become the basis for the next step.
From underwater imaging to school insight, let's discuss the farming scenario and technical path that fit you.
Talk to the Tech Team